Know Your Emissions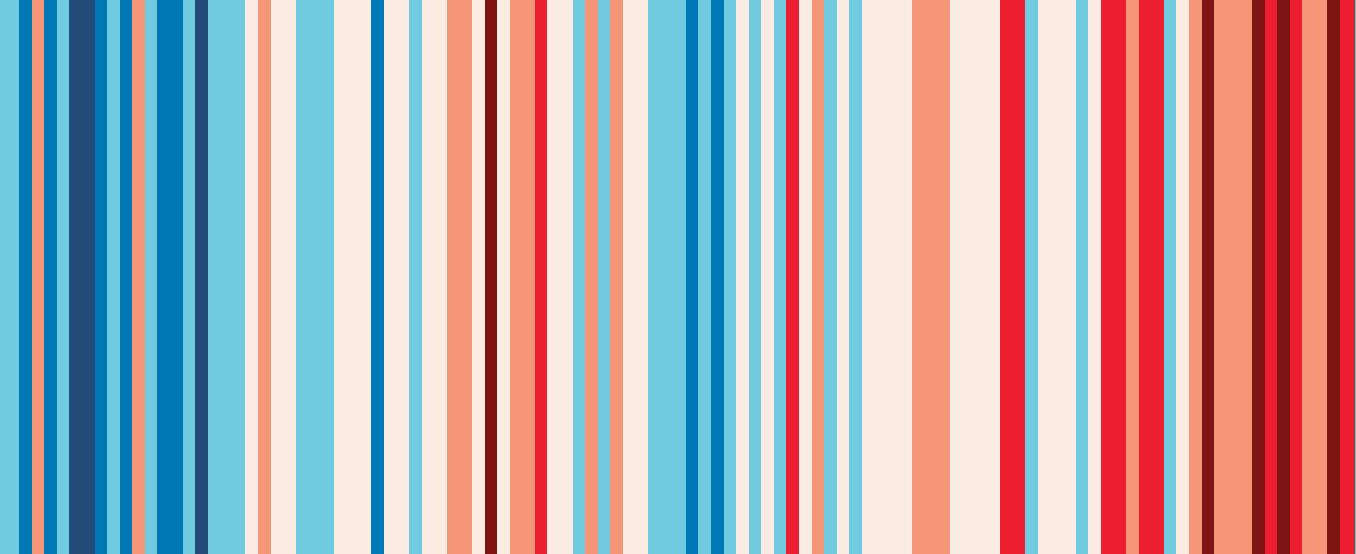
These colors show average temperatures in Norwich between 1910 and 2018, with one stripe per year. Blue stripes represent years with temperatures below the average; white stripes represent average temperatures; and orange and red stripes represent years with temperatures above the average. The last average year was 2004.
Check out The Jump, a grassroots group in the UK, which highlights six shifts to protect our earth. The shifts are "clear, constructive, impactful, doable." The Jump encourages people to sign up to make the shifts for at least a month, and provides lots of ideas on how!
|
Estimate the carbon emissions of your household with this Household carbon footprint calculator, and see how various changes will reduce your emissions total. This checklist provides examples for an "average" Norwich household.
Resources on reducing the carbon impact in your home are here. Resources on reducing the carbon impact of getting around are here. Resources on reducing the carbon impact of what you eat are here. Here are articles and resources to help you prioritize your actions to reduce your carbon emissions:
|